



What Broadcasters Know Before The First Ball Is Bowled
As cricket enters an era increasingly shaped by artificial intelligence and advanced analytics, data has become as important to the game as talent and technique
As cricket enters an era increasingly shaped by artificial intelligence and advanced analytics, data has become as important to the game as talent and technique. From influencing team selection and tactical decisions to transforming the way matches are broadcast, analytics now sits at the heart of modern cricket. In this interview, CricViz Head of Analytics Services Sankar Rajgopal explains how the sport's relationship with data has evolved over the years, the growing role of AI in enhancing fan engagement, and why players and teams that embrace analytics are gaining a crucial edge in an increasingly competitive landscape.
1. A few days back R Ashwin marvelled at the use of AI in cricket data analysis. Over the years, how have you seen data analytics change cricket?
Ashwin's has been fairly direct about players who don't get on top of AI and analytics risking a shorter career, and how data is consumed and used will be a real differentiator going forward. It's a view I'd echo from the other side of the fence.
When I started, in Tests and ODIs, analytics was largely averages, strike rates, economy rates - the basic vocabulary of the game. T20 broke that. You can't use one set of numbers to judge every batsman or bowler anymore - an opener and a finisher are solving completely different problems, so the metrics had to fragment and get role-specific. The bigger shift is that it's moved from being a back-room, post-facto exercise to a live decision-making tool - coaches now want to see the data before making a call, not after. And critically, players themselves have bought in. Ten years ago there was real skepticism from dressing rooms; now most players are aware of matchups and understand why a particular bowler is being targeted at them.
2. As you provide data for broadcasters, could you explain in a few words, a real-time experience of how your data analytics helped better the coverage?
Let me walk you through what a typical broadcast day looks like from our side. A day before the game, every producer and commentator on that match gets a preview document from our analysts flagging the main talking points - the storylines worth building the broadcast around. All of these are fed into the graphics engine via APIs, so the moment a commentator wants to bring up a story, the graphic is already sitting there ready to go, no scrambling required.
Then during the game itself, our Centurion match page is running in the background - a live summary of the game so far, key insights, upcoming milestones, and player strengths and weaknesses, all updating ball by ball. We also use Hawk-Eye ball-tracking data to tell producers and commentators exactly how a pitch is behaving on the day - pace, bounce, deviation, spin - which is something you simply can't get from just watching. Between the pre-match hooks and the live insights, our analysts are essentially feeding the broadcast a constant stream of story hooks, so there's always another layer to keep viewers engaged, even when the game itself goes quiet.
3. To what extent do you use AI in enhancing sports coverage?
Broadcast coverage is all about keeping the audience hooked through rich storytelling. AI and pattern recognition help us surface trends that aren't obvious to the naked eye. For instance, if Virat Kohli brings up a fifty and every boundary has come through the off side, that pattern shows up on our Centurion match page instantly - and that insight gets relayed straight to producers and commentators in real time.
Even before AI became the industry buzzword, we were already running data science models like WinViz (live win probability), PredictViz (score prediction), and PitchViz (pitch behaviour), and more recently Skill Scales (format-specific player skill ratings) - all built for the same purpose: deepening viewer engagement through insight, not just information.
4. From when would you say cricket coverage got heavily reliant on data too?
I'd point to around 2012 as the real turning point. Before that, commentary was largely reactive - commentators responded to what they saw in the moment, and data was mostly limited to the occasional statistical record being read out. From 2012 onward, ball-by-ball data started being used properly in broadcasts, giving commentators the ability to analyse player strengths and weaknesses in real time and offer predictive insight based on historical patterns, rather than just describing the action.
That evolved further in 2018 with the launch of Select Dugout at Star Sports - a feed that was driven entirely by analytics, built specifically to weave data into the broadcast as a storytelling layer rather than a standalone graphic.
5. As someone who follows cricket, any particular data that you encountered during a series/match that startled you
I used to work with the IPL team, Punjab Kings as their R&D data consultant. During the 2022 auction, we built the squad around six-hitting and market inefficiencies, the boundary-hitting graph across IPL seasons only kept climbing. What struck me wasn't the aggression itself, but how selective the best hitters were - they picked their moments to attack and left the rest, and that discipline was visible in the data even though the eye-test just reads as all-out hitting.
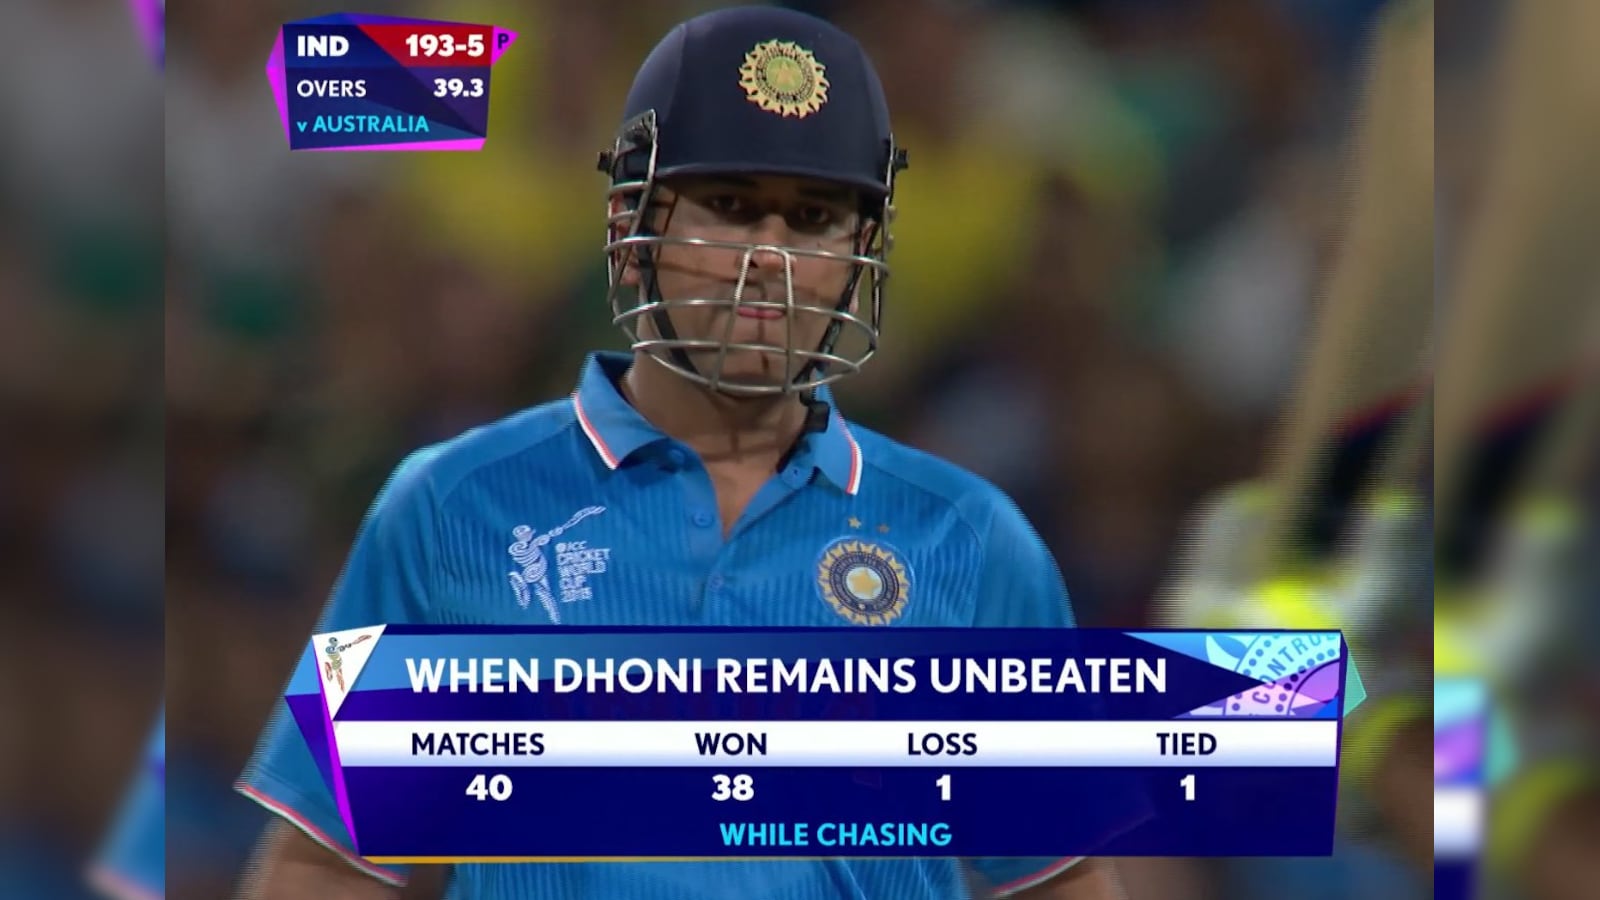
On the broadcast side, one moment stands out. During the 2015 World Cup semi-final, when India's chase against Australia started to look hopeless, we put out a graphic (attached) showing that as long as Dhoni was still at the crease, India retained a real chance - based on his record of near-unbeaten chases. We tracked a noticeable spike in viewer retention right after that graphic aired - a good example of how a single well-timed data point can hold an audience through a game that looks all but over.
 MS Dhoni
 India Cricket Team